By Gaurav · · 18 min read
- databases
- sql
- performance
- postgres
- indexing
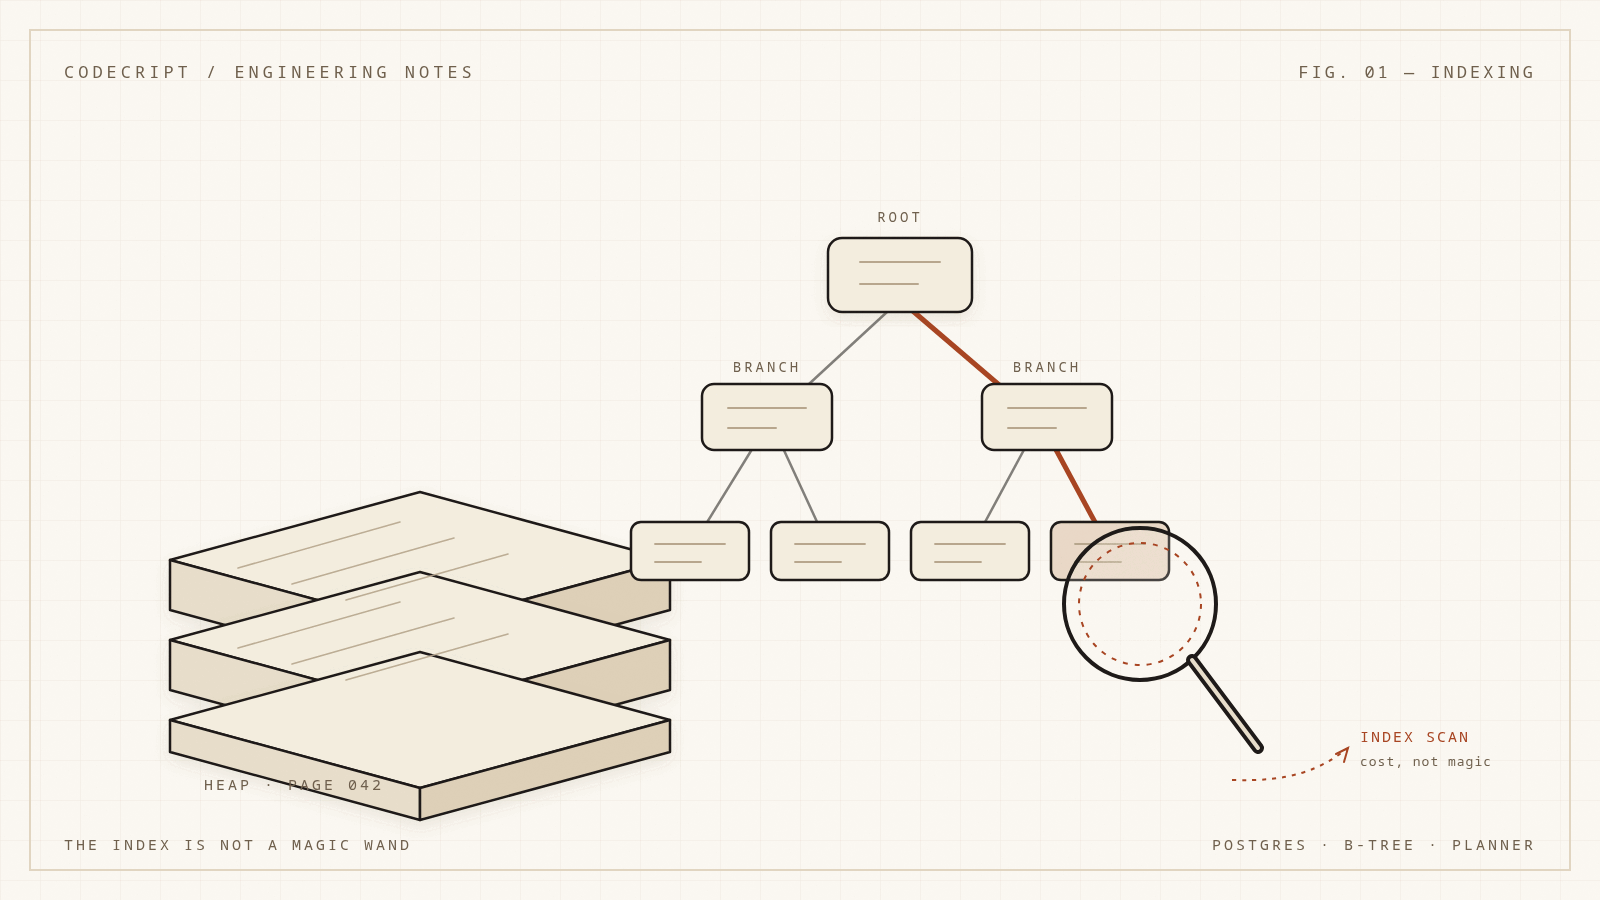
The first rule of database performance is "add an index." The second rule is "measure before and after," and most people skip it.
An index is a data structure with a cost. It makes some reads faster and every write a little slower. It also competes for memory, changes the planner's estimates, and can quietly stop being useful as the data distribution changes. Sometimes the planner looks at your new index and decides, correctly, that a sequential scan is cheaper. That is not a bug; it is the whole point of a cost-based optimizer.
This article is about developing an intuition for when an index helps, when it does not, and how to verify the difference. It focuses on PostgreSQL because its planner and storage model are well documented and widely used, but the concepts transfer to MySQL/InnoDB, SQL Server, and most B-tree-backed engines. There are runnable queries against the sample dataset, so you can inspect real plans instead of only reading about them.
The heap is the table
To understand an index, you first have to understand what it is indexing. A PostgreSQL table is a heap: an unordered collection of 8 KB pages. Each page contains a header, line pointers, and tuples. A tuple is a row version, with a header that includes transaction visibility information (xmin, xmax) and a null bitmap.
A row's physical address is a CTID: a pair of (block number, item offset). It is stable until the row is updated or the table is vacuumed and reorganized. An index stores key values plus CTIDs. That is the fundamental contract: the index tells you where the row version lives; the heap tells you whether it is visible to your transaction and what the other columns contain.
Several consequences follow immediately:
- An index lookup is usually two steps: find the CTID in the index, then fetch the tuple from the heap. Both can cost I/O.
- Dead tuples still occupy space until vacuum. Index entries pointing at dead tuples are not immediately useful but must still be traversed.
UPDATEcreates a new tuple version. If an indexed column changes, every index on that column needs a new entry.- The heap has no inherent order.
ORDER BYwithout an index requires a sort, or a sequential scan plus a top-N sort.
A table with 10 million narrow rows might occupy tens of thousands of pages. An index on a single integer column might occupy a few thousand. The ratio matters: the planner is choosing between reading a lot of heap pages and reading a smaller index plus fetching selected heap pages.
What a B-tree index actually is
A PostgreSQL B-tree is a balanced tree of 8 KB pages. Interior pages contain separator keys (high keys) and pointers to child pages. Leaf pages contain the indexed key and a CTID, and are linked left-to-right so that range scans and ordered reads can walk the leaves without returning to the root.
flowchart TD
  R[Root page<br/>high keys + child pointers] --> I1[Interior page]
  R --> I2[Interior page]
  I1 --> L1[Leaf: 1..100]
  I1 --> L2[Leaf: 101..200]
  I2 --> L3[Leaf: 201..300]
  I2 --> L4[Leaf: 301..400]
  L1 <--> L2
  L2 <--> L3
  L3 <--> L4
The fanout is large because a page holds hundreds of keys. That makes the tree shallow. A few million rows usually fit in a height of three or four: root, one or two interior levels, and leaves. A lookup therefore touches a handful of pages, often cached, rather than scanning the table.
The leaf entries are sorted by key. For a composite index (a, b, c), the sort order is lexicographic: first a, then b, then c. That ordering is what makes composite indexes useful for filters and sorting, and it is also what makes column order so important.
Each index entry is not free. A B-tree entry includes the key columns (or a hash/truncated representation for some types), the CTID, and some overhead. Wide keys, many columns, and bloated pages all increase index size. A covering index with many INCLUDE columns can approach the size of a narrow table.
The planner is doing cost accounting
PostgreSQL's planner is cost-based. It enumerates access paths, estimates the number of rows each will produce, assigns costs, and picks the cheapest. The costs are not milliseconds. They are arbitrary units calibrated by constants such as:
| Constant | Default | Meaning |
|---|---|---|
seq_page_cost |
1.0 | Cost of a sequential page fetch |
random_page_cost |
4.0 | Cost of a random page fetch |
cpu_tuple_cost |
0.01 | CPU cost per tuple processed |
cpu_index_tuple_cost |
0.005 | CPU cost per index entry |
cpu_operator_cost |
0.0025 | CPU cost per operator/function call |
effective_cache_size |
4 GB | Planner's estimate of OS + shared cache |
The defaults assume spinning disks, where random I/O is much more expensive than sequential I/O. On SSDs, random_page_cost is often set closer to 1.1–2.0, which makes index access more attractive. Changing these constants does not change the data; it changes the planner's model of the hardware. That is legitimate, but it should be done with measurements, not folklore.
The planner also needs statistics. ANALYZE samples the table and populates pg_statistic (exposed through pg_stats) with:
null_frac: fraction of nullsn_distinct: estimated distinct values (positive absolute, negative fraction)most_common_vals/most_common_freqs: frequent values and their frequencieshistogram_bounds: distribution of the non-frequent valuescorrelation: how closely physical row order matches the indexed order, from -1 to 1
correlation is the quiet hero of index costing. A value near 1 means the index order matches the heap order, so an index scan reads heap pages sequentially. A value near 0 means index order is scattered, so each heap fetch is likely a random page. This is why an index on created_at in an append-only table is usually efficient, while an index on a random UUID is not.
You can inspect the statistics for the sample table:
SELECT attname, n_distinct, correlation, null_frac
FROM pg_stats
WHERE schemaname = 'public' AND tablename = 'orders'
ORDER BY attname;
Reading a plan without lying to yourself
EXPLAIN estimates. EXPLAIN ANALYZE actually runs the query and reports both estimates and reality. The gap between them is often the most useful information in the output.
Always ask for buffers:
EXPLAIN (ANALYZE, BUFFERS)
SELECT id, status, placed_at
FROM orders
WHERE status = 'pending'
ORDER BY placed_at DESC
LIMIT 5;
The sample dataset has 180 orders, so the planner may choose a sequential scan even if an index exists. That is correct: a tiny table fits in a couple of pages, and scanning it is cheaper than descending a tree and fetching rows. This is the first lesson. Indexes are for scale and selectivity, not for making every query look sophisticated.
On a larger table, a plan might look like this:
Limit  (cost=0.43..12.84 rows=5 width=24) (actual time=0.041..0.058 rows=5 loops=1)
  ->  Index Scan using orders_status_placed_at_idx on orders
        (cost=0.43..24813.20 rows=10000 width=24) (actual time=0.039..0.055 rows=5 loops=1)
        Index Cond: (status = 'pending'::text)
        Buffers: shared hit=8
Planning Time: 0.212 ms
Execution Time: 0.081 ms
What to look at, in order:
- Estimated vs. actual rows. A factor-of-ten mismatch is a red flag. A factor-of-thousand mismatch means the planner is flying blind. Check statistics, data skew, and whether the predicate is sargable.
- Loops. A nested loop with
loops=100000did 100,000 index lookups. Multiply the per-loop time by loops to see the real cost. - Buffers.
shared hitmeans pages were found in cache.readmeans the process had to read from the OS or disk. High read counts explain latency even when the plan looks good. - Rows removed by filter. If an index scan returns 50,000 rows and a filter discards 49,950, the index is not selective enough for that predicate.
- Sort and Limit. A
Sortnode means the index did not provide the required order. ALimitabove a sort can still be efficient if the sort is top-N and the row count is small. - Width. Wide rows mean more data copied and more memory used by sorts and hash tables.
The plan is a hypothesis, not a verdict. Evaluate it against the data distribution, the cache state, and the latency target. A plan that is optimal for a cached, warm database may be terrible on a cold replica.
The tipping point is selectivity
The core question is: how many rows will this predicate match, and how expensive is it to fetch them?
Suppose a table has N rows and a predicate matches fraction f. A sequential scan reads roughly all table pages: cost proportional to N (plus CPU per row). An index scan reads the index path, then fetches f * N heap tuples. If the heap is physically ordered by the index key (high correlation), the fetches are cheap and sequential. If not, each fetch is a random page, and the cost can be much higher.
The planner compares these costs. Around some threshold, it switches. For a selective equality on a high-cardinality column, the index usually wins. For a low-selectivity predicate such as status = 'active' when 80% of rows are active, the sequential scan usually wins, even if the index exists.
Low-selectivity indexes are not useless. They can still help if the query is covered by the index (no heap fetch), if the rows are physically clustered, or if the query has a LIMIT and the index provides the required order. But a plain B-tree on a boolean column is rarely a good investment for a read-mostly query that returns half the table.
This is also why LIMIT changes everything. A query that returns 50 rows out of 10 million can stop early if the index provides the order. The planner knows this and may choose an index scan even when the predicate matches many rows, because it only needs to read until the limit is satisfied.
Bitmap scans: the middle path
When a single index access path is not obviously best, PostgreSQL can build a bitmap of matching CTIDs and then read the heap in physical order. This is the Bitmap Index Scan + Bitmap Heap Scan combination.
A bitmap scan is useful when:
- The predicate matches enough rows that random heap fetches would be expensive.
- Multiple indexes can be combined with
AND/OR. - The number of matching pages is manageable.
It has a cost: the bitmap itself uses memory, controlled by work_mem. If the bitmap exceeds the limit, pages become "lossy" and the heap scan has to recheck conditions, which can be slower than expected.
Bitmap Heap Scan on orders  (cost=120.00..2400.00 rows=5000 width=24)
  Recheck Cond: ((status = 'pending'::text) OR (total_cents > 100000))
  ->  BitmapOr  (cost=120.00..120.00 rows=5000 width=0)
        ->  Bitmap Index Scan on orders_status_idx
        ->  Bitmap Index Scan on orders_total_cents_idx
A bitmap scan is often the planner's compromise: better than thousands of random fetches, worse than a truly selective index lookup. If you see one and the query is still slow, check whether the bitmap is lossy or whether the predicate combination is simply returning too many rows.
Composite indexes and column order
A composite index on (a, b, c) is sorted by a, then b, then c. It can efficiently support:
WHERE a = ?WHERE a = ? AND b = ?WHERE a = ? AND b = ? AND c = ?WHERE a = ? AND b > ?(range on the last used column)WHERE a = ? ORDER BY b, cORDER BY a, b, c(full index order)
It is much less useful for:
WHERE b = ?without a condition onaWHERE b = ? AND c = ?withoutaWHERE a = ? AND c = ?with a gap atb(the index can still filter ona, butcis not a usable range condition)
The rule of thumb is: equality columns first, then the column used for range or ordering, then included payload columns. The exact order depends on the query mix, but the leftmost prefix is the key constraint.
CREATE INDEX CONCURRENTLY idx_orders_status_placed_at
  ON orders (status, placed_at DESC);
This index supports "recent orders with a given status" directly:
SELECT id, placed_at
FROM orders
WHERE status = 'pending'
ORDER BY placed_at DESC
LIMIT 50;
The planner can seek to status = 'pending' and read the leaf entries in placed_at DESC order, stopping after 50. No sort is needed. Compare that with a separate index on status and a separate index on placed_at: the planner may use one to filter, then sort the results, or combine them with a bitmap, but neither gives the exact ordered access path.
Covering indexes and index-only scans
A regular index lookup fetches the heap tuple to get columns that are not in the index. If the query only needs columns that are in the index, PostgreSQL can sometimes answer from the index alone. That is an index-only scan.
CREATE INDEX CONCURRENTLY idx_orders_status_placed_at_covering
  ON orders (status, placed_at DESC) INCLUDE (total_cents);
INCLUDE columns are stored in the leaf entries but are not part of the key ordering. They make the index larger and increase write cost, but they can eliminate heap fetches for queries that need those columns.
An index-only scan is not guaranteed just because the columns are covered. PostgreSQL also checks the visibility map to decide whether each tuple is visible to all transactions. If the page is not marked all-visible, it still has to consult the heap. That is why vacuum matters: a bloated or recently updated table may not get index-only scans until the visibility map catches up.
Covering indexes are a tradeoff. They can turn a random-heap-fetch query into an index-only scan, which is a huge win for read-heavy workloads. They also duplicate data, increase index size, slow down writes, and need to be maintained. Use them for specific, high-value queries, not as a default.
A short catalog of index types
B-tree is the default and the right starting point for most equality, range, and ordering queries. PostgreSQL also offers specialized index types:
| Type | Best for | Notes |
|---|---|---|
| B-tree | Equality, ranges, sorting, prefix matching | The general-purpose default |
| Hash | Equality only | Smaller than B-tree for wide keys, no range/order support |
| GIN | Arrays, jsonb, full-text search, trigram matching |
Inverted index; fast reads, slower writes; pending list |
| GiST | Geometry, ranges, nearest-neighbor, exclusion constraints | Extensible; good for spatial and range types |
| SP-GiST | Non-balanced structures: quadtrees, radix trees, text search | Specialized; can outperform GiST for some data |
| BRIN | Very large, naturally ordered tables (time series) | Tiny index; stores min/max per block range; useless if data is scattered |
| Bloom (extension) | Many equality columns with low individual selectivity | Probabilistic; can combine many columns cheaply |
The most common mistake is using B-tree for everything. A jsonb containment query needs GIN. A tsvector full-text search needs GIN. A geometric "within distance" query needs GiST or SP-GiST. A petabyte-scale time-series table may be better served by BRIN than by a B-tree that would be enormous.
The second most common mistake is using a specialized index without understanding its write cost and maintenance. GIN indexes, in particular, have a pending list and can be expensive to update under heavy write load. Measure the write path, not just the read path.
Partial and expression indexes
Two underused tools solve problems that a plain column index cannot.
A partial index indexes only the rows that satisfy a predicate:
CREATE INDEX CONCURRENTLY idx_orders_pending
  ON orders (placed_at DESC)
  WHERE status = 'pending';
If pending orders are a small fraction of the table, the index is much smaller and cheaper to maintain than a full index. The predicate must match the query exactly enough for the planner to use it; PostgreSQL's predicate implication logic is conservative, so keep the condition simple.
An expression index indexes a computed value:
CREATE INDEX CONCURRENTLY idx_users_lower_email
  ON users (lower(email));
Now WHERE lower(email) = 'ada@example.com' can use the index. Without it, the function call hides the column from the index and forces a scan unless the planner can use an alternative. Expression indexes are also useful for date_trunc, normalized JSON fields, and generated columns.
The catch is that the query must use the same expression, with the same semantics. lower(email) and email ILIKE ... are not the same thing. A different collation or a cast can also prevent a match.
Write amplification: every index has a landlord
Every INSERT adds an entry to every index on the table. Every DELETE marks entries for cleanup. Every UPDATE that changes an indexed column adds a new entry and leaves the old one to be reclaimed.
This is write amplification. A table with ten indexes does roughly ten index operations per inserted row. On a write-heavy workload, that can dominate CPU, I/O, and WAL volume.
PostgreSQL has an optimization called HOT (Heap-Only Tuples). If an update does not change any indexed column, and the new tuple fits on the same page (respecting fillfactor), PostgreSQL can avoid updating the indexes at all. The new tuple is linked to the old one, and the index still points at the old CTID, which redirects to the new version. This is why fillfactor matters on update-heavy tables: leaving free space on pages makes HOT updates more likely.
Indexes also bloat. Deleted and updated entries remain until vacuum reclaims them. A table with many indexes and frequent updates can accumulate dead entries faster than autovacuum cleans them, especially under long-running transactions that hold back the visibility horizon. Bloat increases index size, which increases the number of pages read, which increases latency — a slow feedback loop that is easy to miss.
Practical implications:
- Do not add an index "just in case." Every index is a tax on writes.
- Prefer narrower indexes. A composite index with four columns is not free.
- Use
fillfactoron update-heavy tables to preserve HOT updates. - Monitor bloat and vacuum lag, not just query latency.
- Remember that
CREATE INDEXitself writes a lot and can saturate I/O.
Building indexes without stopping the world
A plain CREATE INDEX takes a SHARE lock that blocks writes to the table for the duration of the build. On a large production table, that is an outage. CREATE INDEX CONCURRENTLY avoids blocking writes, but it is not free:
- It performs two scans of the table.
- It takes longer and uses more I/O.
- It cannot run inside a transaction block.
- If it fails, it leaves an invalid index behind, which still consumes space and write overhead until dropped.
After a failed concurrent build, check pg_index.indisvalid and drop the invalid index:
SELECT indexrelid::regclass AS index_name, indisvalid
FROM pg_index
WHERE indrelid = 'orders'::regclass;
DROP INDEX CONCURRENTLY IF EXISTS idx_orders_status_placed_at;
Also consider the lock level of the operation you are running. CREATE INDEX CONCURRENTLY still takes a brief stronger lock at the beginning and end. On a busy table, schedule it deliberately, monitor for lock waits, and have a rollback plan.
Why an index silently stops being used
A surprising number of "the index exists but the query is slow" cases come from the query shape, not the index. Common causes:
A function wraps the column. WHERE lower(email) = ? cannot use an index on email. Use an expression index or normalize the data.
An implicit cast changes the type. WHERE user_id = '123' may cast the column or the literal depending on types. If the column is indexed as uuid and the parameter is text, the comparison may not use the index the way you expect. Be explicit about types.
A leading wildcard defeats the B-tree. WHERE name LIKE '%smith' cannot use a normal B-tree prefix range. Use a trigram GIN index (pg_trgm) or a different search strategy.
OR and NOT confuse the planner. OR can sometimes be handled with a bitmap OR, but NOT and != are often not selective in the way people assume. Rewrite or add a partial index if the predicate is stable.
Collation and ordering mismatch. An index built with one collation may not satisfy an ORDER BY using another. ORDER BY col DESC NULLS LAST may not match an index built with the default null ordering. Check the exact ordering semantics.
Statistics are stale or unrepresentative. A column with a skewed distribution needs ANALYZE, and sometimes a higher statistics target. A single ANALYZE after a bulk load is not a permanent fix.
Prepared statements choose a generic plan. PostgreSQL may switch to a generic plan after several executions, and a plan that is good for one parameter value can be bad for another. plan_cache_mode and generic_plan behavior matter for skewed data. Inspect with EXPLAIN (GENERIC_PLAN) where available.
The predicate is not sargable. Wrapping a column in arithmetic (WHERE price * 1.2 > 100) or comparing two columns can prevent index use. Rewrite so the indexed column stands alone.
The index is invalid or the wrong one exists. Duplicate indexes, invalid indexes after a failed build, and indexes on the wrong column order all look fine in \d but do nothing for the query. Verify with EXPLAIN, not with the catalog alone.
Operational hygiene: keep the index set honest
Indexes accumulate. Teams add them for incidents and rarely remove them. Over time, a table can carry dozens of indexes, most of which are unused, duplicated, or superseded by a better composite index.
PostgreSQL tracks usage:
SELECT
  indexrelname AS index_name,
  idx_scan,
  idx_tup_read,
  idx_tup_fetch,
  pg_size_pretty(pg_relation_size(indexrelid)) AS size
FROM pg_stat_user_indexes
WHERE relname = 'orders'
ORDER BY idx_scan, pg_relation_size(indexrelid) DESC;
An idx_scan of zero after a representative period is a candidate for removal — unless it backs a unique constraint or a foreign-key enforcement path. Be careful: statistics reset on restart or pg_stat_reset, and a monthly report may not have run during your observation window.
Look for duplicates and prefixes:
(a)and(a, b): the first is usually redundant with the second.(a, b)and(b, a): different indexes; one may still be useful for queries that filter only onb.- Unique indexes and primary keys: they enforce constraints even if unused for reads; do not drop them casually.
Also monitor index size and bloat. An index that is larger than the table it serves is usually a sign of bloat, a poor key choice, or too many included columns. pgstattuple can measure bloat precisely, though it reads the whole relation.
A worked example
Suppose you have an orders table with 20 million rows and these queries:
-- Q1: customer order history
SELECT id, status, total_cents, placed_at
FROM orders
WHERE user_id = $1
ORDER BY placed_at DESC
LIMIT 20;

-- Q2: operations queue
SELECT id, user_id, total_cents
FROM orders
WHERE status = 'pending'
ORDER BY placed_at ASC
LIMIT 100;
The initial indexes are orders(user_id) and orders(placed_at). Q1 uses the user_id index to find the customer's orders, then sorts them by placed_at, then takes 20. If a customer has thousands of orders, the sort is wasteful. A composite index on (user_id, placed_at DESC) lets the database seek to the customer and read the first 20 in order. The total_cents column could be included if the heap fetch is a bottleneck.
For Q2, the placed_at index is not enough: the query filters on status and orders by placed_at. A partial composite index on (status, placed_at ASC) WHERE status = 'pending' is smaller and directly supports the query. If pending orders are a large fraction of the table, the partial predicate is less useful; then a full composite index may be better.
The design process is not "add an index per column." It is:
- Collect the actual query shapes, including filters, joins, ordering, and limits.
- Estimate selectivity from real data.
- Choose a key order that supports equality first, then range/order.
- Consider a partial index for stable, selective predicates.
- Consider
INCLUDEcolumns only when heap fetches dominate. - Measure with
EXPLAIN (ANALYZE, BUFFERS)before and after. - Watch write throughput and index size after deployment.
- Remove indexes that do not earn their keep.
The checklist
Before adding an index, answer these questions:
- What is the exact query pattern? Include
ORDER BY,LIMIT, and join conditions. - How selective is the predicate on real data, not on a test fixture?
- Is the column already covered by the leading columns of an existing index?
- Does the query return a small number of rows, or a large fraction of the table?
- Is the table physically ordered by the key? Check
correlation. - What is the write rate, and how many indexes already exist?
- Can the index be built
CONCURRENTLYwithout blocking writes? - Is a partial or expression index a better fit?
- Will the index be used after a schema or query change, or will it silently rot?
After adding it, verify with EXPLAIN (ANALYZE, BUFFERS) that the plan changed and the latency improved. If it did not, drop it. An unused index is not free; it costs space, writes, vacuum time, and cognitive overhead.
Final thought
The index is a tool, not a reflex. The planner is trying to minimize estimated cost using a model of your hardware and statistics about your data. Your job is to give it an accurate model, a query shape it can optimize, and a set of indexes that earn their keep on every read and every write.
When an index does not help, that is information. It might mean the query returns too many rows, the data is not selective, the column is wrapped in a function, the statistics are stale, or the write cost outweighs the read benefit. Diagnose the reason instead of adding another index on top. The best index set is not the largest one; it is the smallest one that supports the queries you actually run.